CloudWatch
HTC-Grid uses managed services like DynamoDB, SQS, Redis, EKS. All this services can also be monitored by CloudWatch. In this section we will create a CloudWatch dashboard that monitors a few of the services used in the Control Plane (such as SQS and DynamoDB), and in the Data Plane (such as ElastiCache for Redis)
-
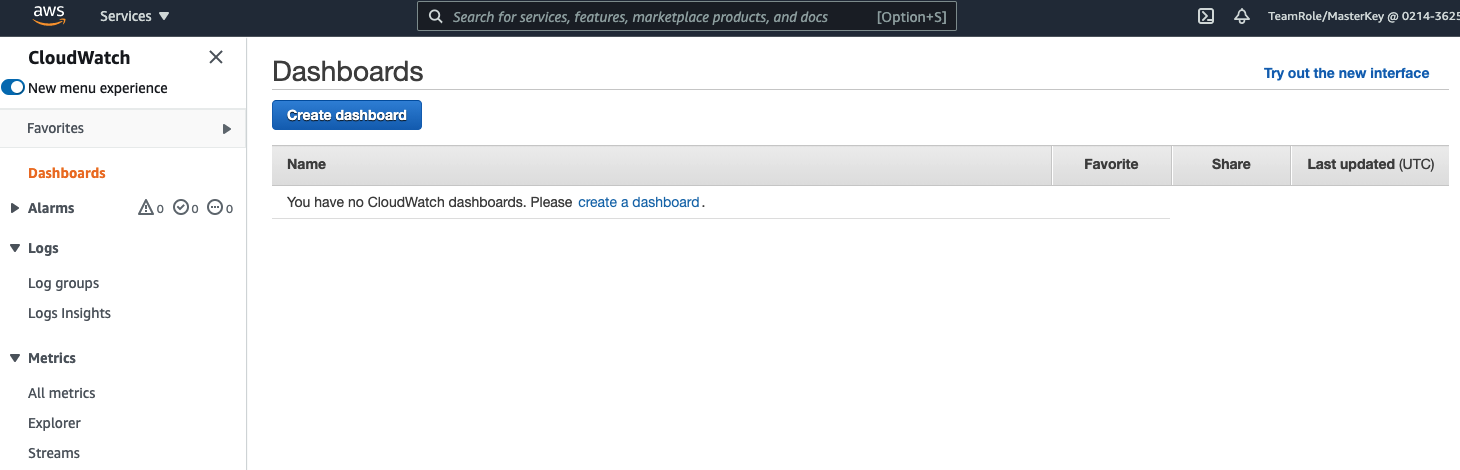
In the AWS console search for CloudWatch and select Dashboard / Create Dashboard.
-
Set htc-grid as the name of the dashboard and select Line as the first widget to add to the dashboard. In the metric section, select the CloudGrid/HTC/Scaling / cluster_name, and finally this should take you to the only exising HTC-grid cluster in your account. Select this cluster (tick on the cluster name), and then click on the Create Widget at the bottom right side of the screen. Finally click on Save Dashboard.
The metric that we have created is the metric that HPA will use to drive the scaling activities of the service. It is based on the pending SQS tasks, but the lambda that drives this metric can be adapted to fit any scaling need.
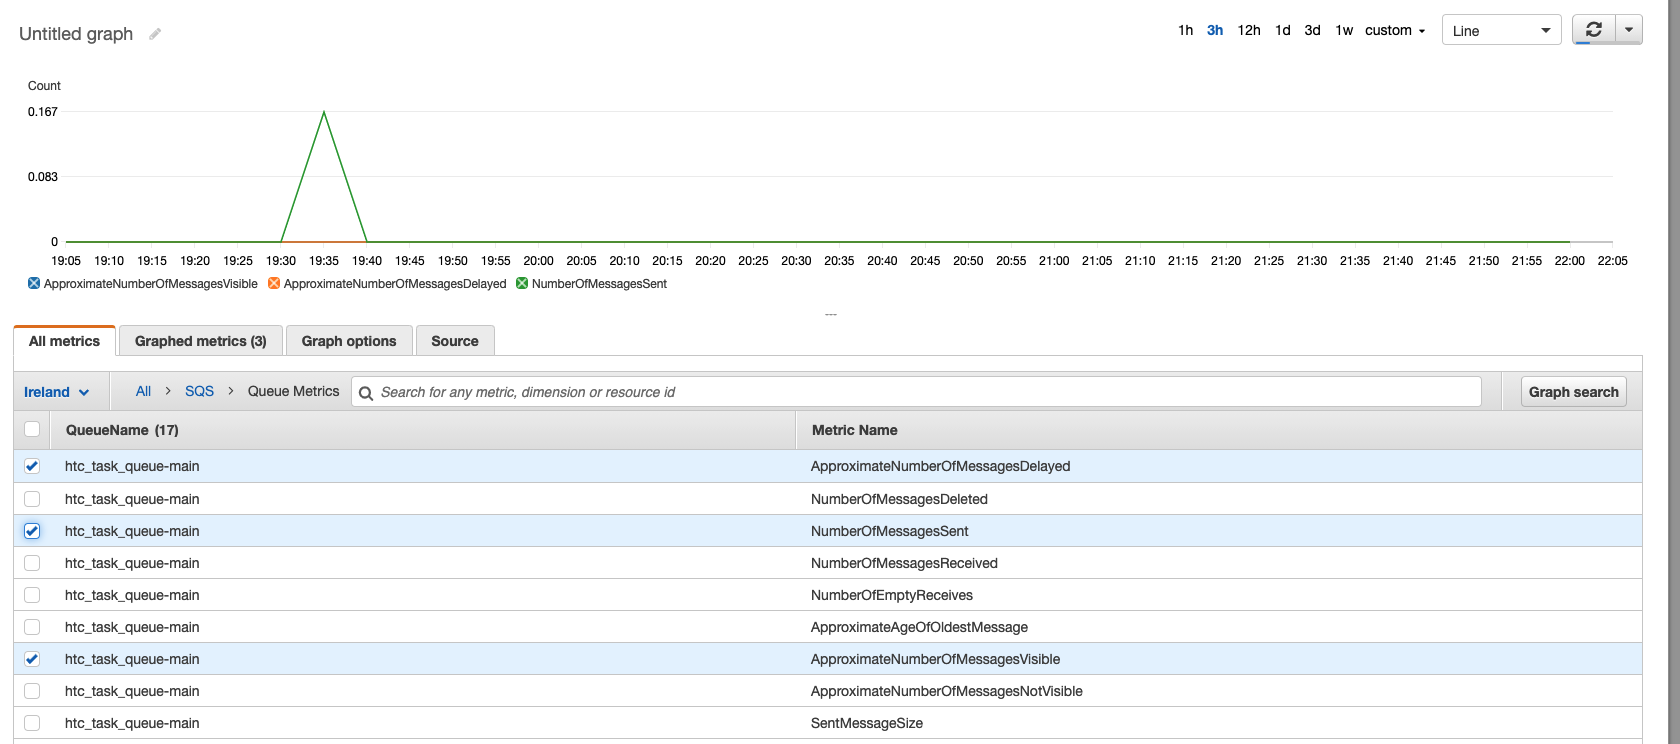
- Next let’s add a new metric, this time around driven by SQS. Click on Add Widget, Select Line, and then in the next screen, select again Metrics. Select SQS and check the boxes for the following
htc-task-queue-mainqueue: ApproximateNumberOfMessagesVisible, ApproximateNumberOfMessagesDelayed and NumberOfMessagesSent. Click on Create Widget and once in the dashboard page, click again on Save Dashboard.
-
Now is time to add a Dashboard for DynamoDB. Again, click on Add Widget, Select Line, and then in the next screen, select again Metrics. This time select DynamoDB and then select the Table Metrics section. There should only be one table at this stage. Select all the entries for the
htc_tasks_status_table-main: ProvisionedReadCapacityUnits, ProvisionedWriteCapacityUnits, ConsumedReadCapacityUnits, ConsumedWriteCapacityUnits. Click on Create Widget and once in the dashboard page, click again on Save Dashboard. -
We got a few services within the Control Plane. Let’s add now some metrics for the Data Plane ElastiCache for Redis. The process is the same as before. click on Add Widget, Select Line, and then in the next screen, select again Metrics. This time select ElastiCache and then Cache Cluster ID. Finally for the
stdin-stdout-cache-maincache available, select the following metrics: CurrConnections, NewConnections. Click on Create Widget and once in the dashboard page, click again on Save Dashboard.

When working with production workloads export CloudWatch dashbaords and alerts created and deploy them as part of the Terraform or CloudFormation IaaC process.