Submitting multiple sessions
So far we have explored a few ways to monitor the cluster, find logs in CloudWatch or stream them from the nodes directly. In this section we are going to submit a batch of tasks.
Creating the Batch file
We will use the same sample application we used before but in this case we will change a few settings. Let’s modify some of those settings. This will create a file named ~/environment/aws-htc-grid/generated/batch-task-test.yaml that generates a total of 10 sessions, with 100 tasks on each. Each task will take 2 seconds to complete.
cd ~/environment/aws-htc-grid
cp ~/environment/aws-htc-grid/generated/single-task-test.yaml ~/environment/aws-htc-grid/generated/batch-task-test.yaml
sed -i -e 's/single-task/batch-task/' -e 's/command: .*$/command: \[\"python3\"\,\"\.\/client.py\"\, \"-n\"\, \"1\"\,  \"--worker_arguments\"\, \"2000 1 1\"\,\"--job_size\"\,\"100\"\,\"--job_batch_size\"\,\"10\"\,\"--log\"\,\"warning\"\]/' ~/environment/aws-htc-grid/generated/batch-task-test.yaml
Submitting the job
We are now ready to submit the job. Execute the following command
cd ~/environment/aws-htc-grid
kubectl apply -f ~/environment/aws-htc-grid/generated/batch-task-test.yaml
Like in the previous run, we can check what the application is doing by streaming the logs from the kubernetes deployment.
kubectl logs job/batch-task -f
It may take a few seconds for the single-job to be deployed to the kubernetes cluster. During that time the kubectl logs command may fail with an error similar to the error below. It only take a few seconds to start the container so, must re-run the command and you should get the logs. Error from server (BadRequest): container "generator" in pod "single-task-vch74" is waiting to start: ContainerCreating.
Dynamic Scaling
This time it will take longer for the command to complete. The client should complete in ~5 minutes. In the background we will check how the Cluster will scale the number of workers and the number of instances. In the architecture section we did mention that the Horizontal Pod Autoscaler would be in charge of scaling up the number of pods. We can review the HPA activity by running the following command:
kubectl get hpa -w
While it runs, we will see something similar in the output to the one below:
NAME               REFERENCE              TARGETS          MINPODS   MAXPODS   REPLICAS   AGE
htc-agent-scaler   Deployment/htc-agent   62125m/2 (avg)   1         100       8          4h57m
htc-agent-scaler   Deployment/htc-agent   31063m/2 (avg)   1         100       16         4h57m
htc-agent-scaler   Deployment/htc-agent   30500m/2 (avg)   1         100       32         4h57m
htc-agent-scaler   Deployment/htc-agent   15250m/2 (avg)   1         100       64         4h57m
htc-agent-scaler   Deployment/htc-agent   9760m/2 (avg)    1         100       100        4h58m
htc-agent-scaler   Deployment/htc-agent   9360m/2 (avg)    1         100       100        4h58m
htc-agent-scaler   Deployment/htc-agent   8630m/2 (avg)    1         100       100        4h59m
The command above for kubectl get hpa -w runs in watch mode. To stop it, similar to the commands that we’ve seen where we stream logs, we can use the Ctrl-C key combination.
The targets, is basically a metric that derives from the metrics that we previously captured in CloudWatch and that is driven by the number of pending tasks in SQS (divided by 2 in this case). Over time if this number is bigger than the current number of REPLICAS, the REPLICA number will keep increasing until it reaches the MAXPODS (Maximum number of workers).
Once the pending number of tasks goes below, the number of REPLICAS will come back to the MINPODS defined in this case as 1. While HPA defines how many workers are needed, Cluster Autoscaler is in charge of scaling-out and scaling-in the cluster.
Cluster Autoscaler will look for pods that are pending because they cannot be allocated in new engines and will take that as a signal to select which node group (Auto Scaling Group) of instances to Scale-out. You can follow Cluster Autoscaler operations by reading the Scale-out and Scale-in operations on the logs with the following command:
kubectl logs -n kube-system deployment/ca-aws-cluster-autoscaler --tail 10 -f
Remember, if you want to repeat the same exercise you will need to delete the current completed batch with the following command
kubectl delete -f ~/environment/aws-htc-grid/generated/batch-task-test.yaml
Checking the dashboards
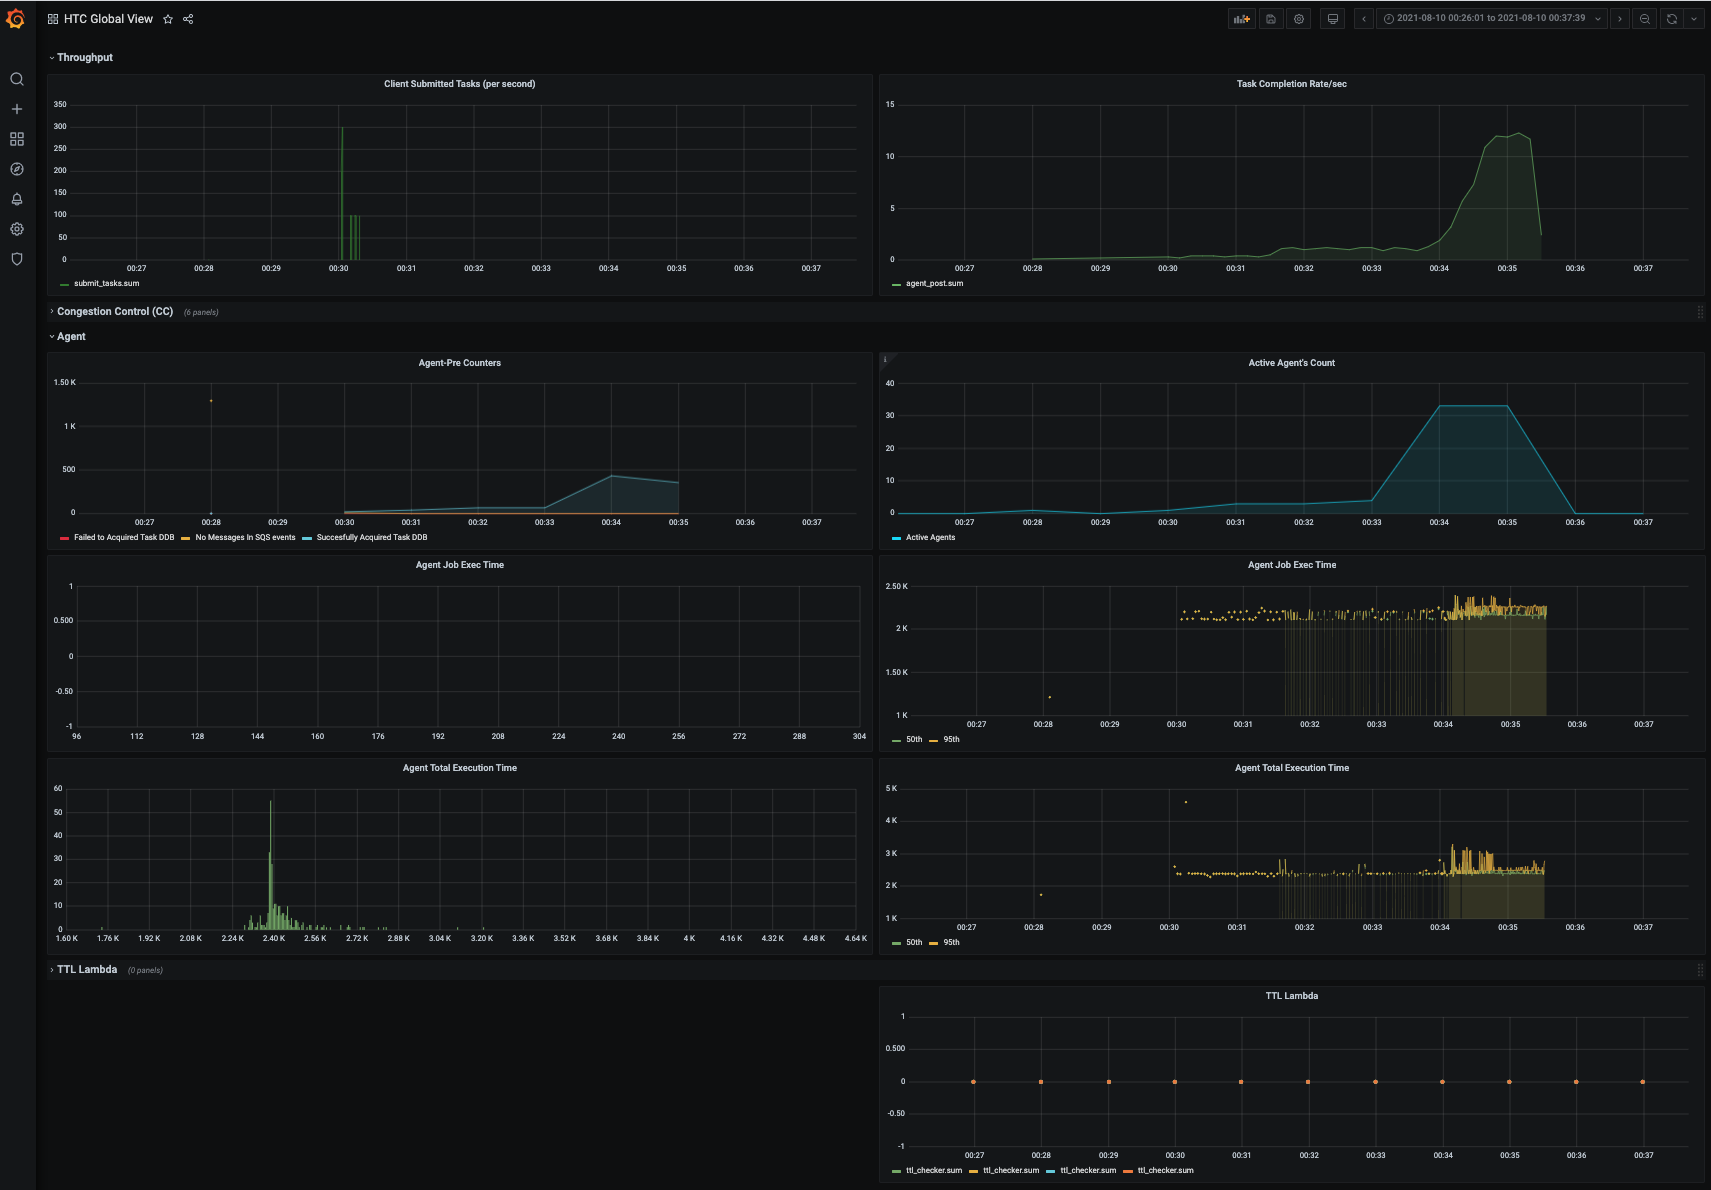
To check how the Scaling exercise has gone, you can re-visit a few of the dashboards that we have already explored in this section.
-
Example of Grafana dashboards
-
CloudWatch
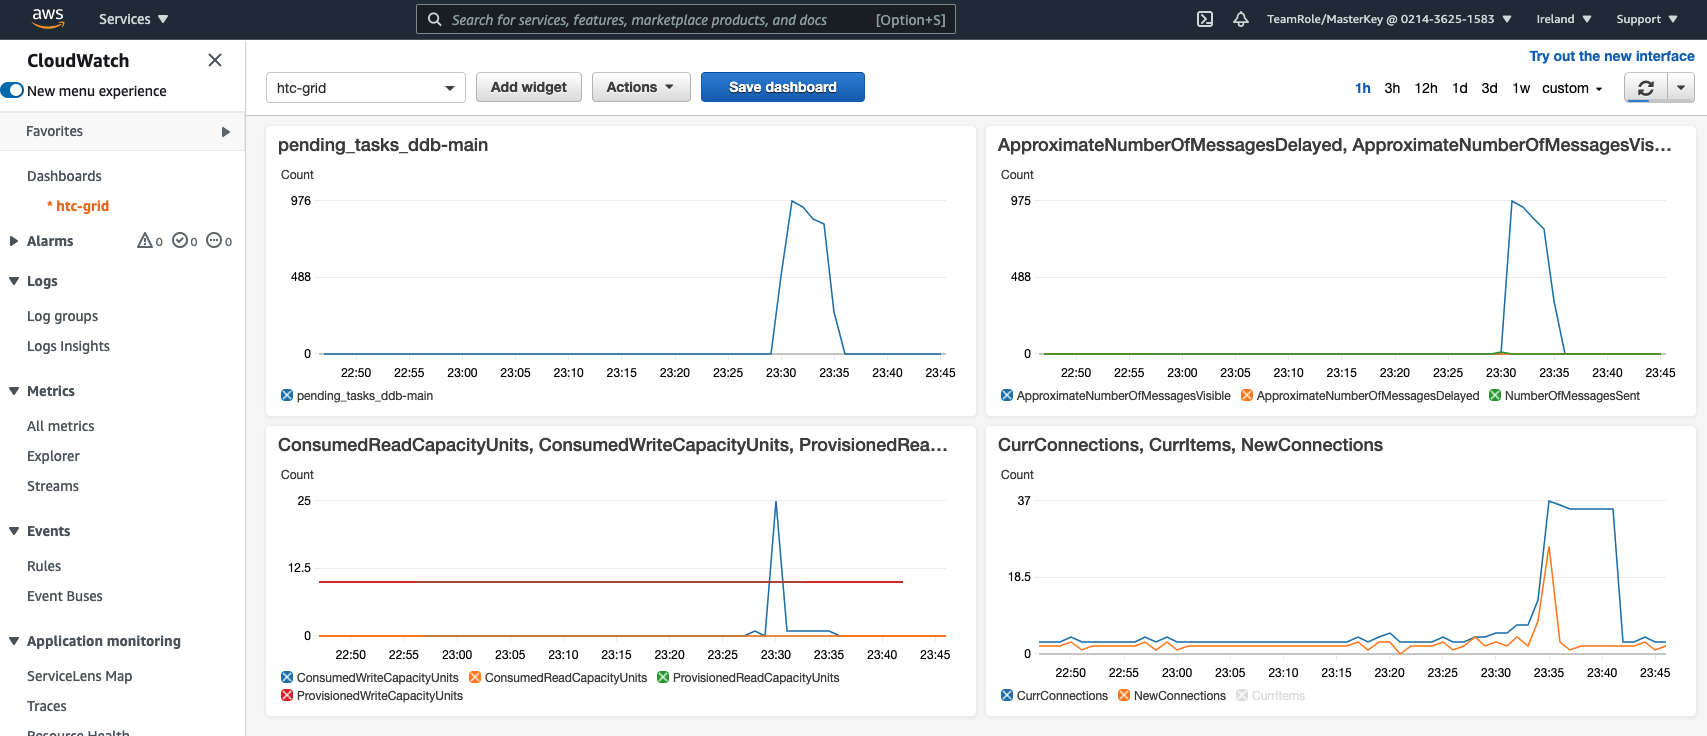
-
Auto Scaling Groups: As a result of Cluster Autoscaler scaling up the cluster, you should be able to see an increase in the number of instances on the Auto Scaling Groups. In the AWS Console go to EC2 / Auto Scaling Groups. The
spotworker groups originally only needed one instance, but during the sale up operation they will reach ~6 to 7 nodes.